set.seed(183475683) # For reproducibility

N <- 100000
lambda <- 0.2
beta <- -0.5
covs <- data.frame(id = seq(N), trt = stats::rbinom(N, 1L, 0.5))

# Inversion method for survival times:
u <- runif(N)
T <- -log(u) / (lambda * exp(covs$trt * beta))Maximum likelihood estimation with {torch}
rstats
likelihood
torch
optimisation
Describing how to implement and optimise likelihod functions using the {torch} package.
Hi everyone!
Today’s blog post is a long time in the making, as I have been playing around with what we’re going to see today for quite a while now.
Let’s start with {torch}: what is that? Well, {torch} is an R package wrapping the libtorch C++ library underlying the PyTorch open-source machine learning framework. It provides a variety of tools for developing machine learning methods, but there’s more: what we will focus on here is automatic differentiation and general-purpose optimisers.
Having these tools at our disposal lets us implement maximum likelihood estimation with state of the art tools. I will illustrate this using a simple parametric survival model, but as you can imagine, this generalises to more complex methods.
Parametric survival model
We will optimise an exponential survival model, for simplicity, whose log-likelihood function can be written as
\[ l(\theta) = d [X \beta] - \exp(X \beta) t + d \log(t) \]
Here \(d\) is the event indicator variable, \(X\) is the model design matrix, \(\beta\) are regression coefficients, and \(t\) is the observed time. Note that \(X\) includes an intercept, which corresponds to the rate parameter \(\lambda\) on the log scale.
Other parametric distributions (such as Weibull, Gompertz, etc.) are equally easy to implement, let me know if you fancy trying this out for yourself!
Simulating data
Let’s start by simulating some data. To simulate survival data from a given parametric distribution, I use the inversion method as described in Bender et al., assuming a single binary covariate (e.g., a binary treatment):
We also apply administrative censoring at time 5:
d <- as.numeric(T <= 5)
T <- pmin(T, 5)
s1 <- data.frame(id = seq(N), eventtime = T, status = d)
dd <- merge(covs, s1)
We simulate data for 10^{5} subjects (which should be plenty enough to get pretty close to the truth if our implementation is correct), a rate parameter \(\lambda\) of 0.2 and a regression coefficient \(\beta\) of -0.5. If interested, a more general implementation of this method can be found in the {simsurv} package.
As a test, let’s fit and plot a Kaplan-Meier survival curve:
library(survival)

KM <- survfit(Surv(eventtime, status) ~ 1, data = dd)
plot(KM, xlab = "Time", ylab = "Survival")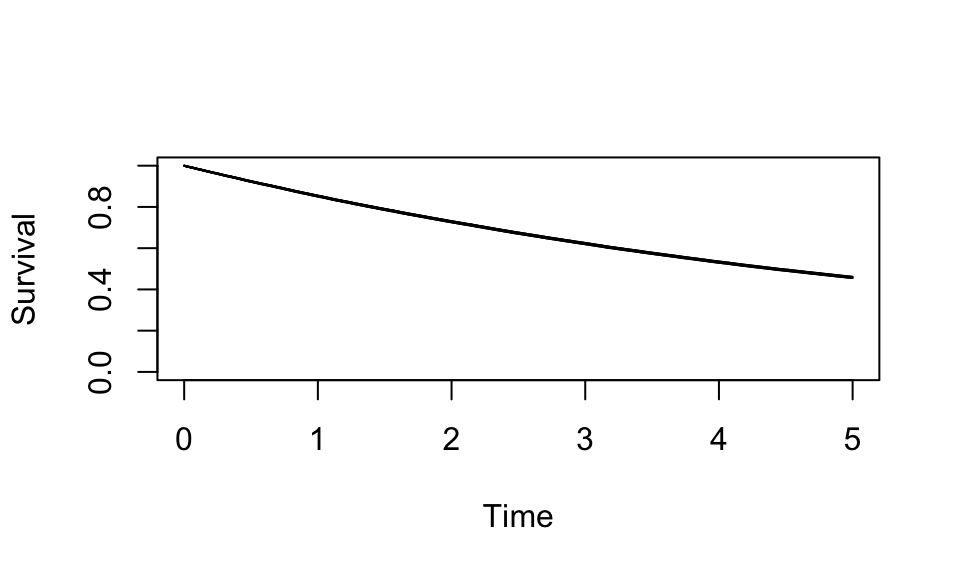
Looks alright!
Likelihood implementation
Now, we implement the (log-) likelihood function using {torch}. The important thing to remember here is that {torch} uses tensors, on which we need to operate e.g. using torch_multiply for matrix multiplication:
library(torch)

log_likelihood <- function(par, data, status, time) {
  ll <- torch_multiply(status, torch_mm(data, par)) -
    torch_multiply(torch_exp(torch_mm(data, par)), time) +
    torch_multiply(status, torch_log(time))
  ll <- -torch_sum(ll)
  return(ll)
}
As a test, let’s define starting values for the model parameters (e.g., fixing their values at 1) and calculate the value of the (negative) log-likelihood function:
xx <- torch_tensor(matrix(c(1, 1), ncol = 1))
log_likelihood(
  par = xx,
  data = torch_tensor(data = model.matrix(~trt, data = dd)),
  status = torch_tensor(matrix(dd$status, ncol = 1)),
  time = torch_tensor(matrix(dd$eventtime, ncol = 1))
)
torch_tensor
1.71723e+06
[ CPUFloatType{} ]Looking good so far.
Likelihood optimisation
The final step consists of implementing the algorithm to optimise the likelihood. We start by re-defining starting values:
x_star <- torch_tensor(matrix(c(1, 1), ncol = 1), requires_grad = TRUE, )Here we need to use the argument requires_grad = TRUE to use automatic differentiation and get gradients for free.
Next, we pick a general-purpose optimiser:
optimizer <- optim_lbfgs(params = x_star, line_search_fn = "strong_wolfe")We pick the L-BFGS algorithm with strong Wolfe conditions for the line search algorithm, but any would do. Note that a comparable algorithm is implemented in base R as optim()’s L-BFGS-B method.
We also need to define one extra function that will be used in the optimisation loop to make each step towards the optimum:
one_step <- function() {
  optimizer$zero_grad()
  value <- log_likelihood(
    par = x_star,
    data = torch_tensor(data = model.matrix(~trt, data = dd)),
    status = torch_tensor(matrix(dd$status, ncol = 1)),
    time = torch_tensor(matrix(dd$eventtime, ncol = 1))
  )
  value$backward(retain_graph = TRUE)
  value
}
We finally have all the bits to actually optimise the likelihood.
We define the required precision as eps = 1e-6, and we loop until the difference in log-likelihood is less than (or equal to) eps:
eps <- 1e-6 # Precision
converged <- FALSE # Used to stop the loop
last_val <- Inf # Need a value to compare to for the first iteration
i <- 0 # Iterations counter

while (!converged) {
  i <- i + 1
  obj_val <- optimizer$step(one_step)
  if (as.logical(torch_less_equal(torch_abs(obj_val - last_val), eps))) {
    print(i) # This will print how many iterations were required before stopping
    converged <- TRUE
    break
  }
  if (i >= 10000) {
    # For safety
    stop("Did not converge after 10000 iterations", call. = FALSE)
  }
  last_val <- obj_val
}
[1] 3That’s it! The results of the optimisation are contained in the x_star object:
x_startorch_tensor
-1.6160
-0.4951
[ CPUFloatType{2,1} ][ requires_grad = TRUE ]…remember that the true values that we simulated data from were:
log(lambda)[1] -1.609438# and
beta[1] -0.5Which is pretty close to what we had estimated. Of course, this is a single replication only, and we might want to test this with smaller sample sizes. Nevertheless, the test sample size is large enough that I would feel comfortable with this implementation.
Conclusions
One thing that is missing from the implementation above is the estimation of confidence intervals for the model parameters.
We get the gradients for free, so that should be straightforward after inverting the Hessian matrix at the optimum. Despite that, the R interface does not implement (yet) direct calculation of the Hessian via the torch.autograd.functional.hessian function so we need to work a little harder for that.
Specifically, we have to differentiate the gradients again to obtain the Hessian matrix:
ll <- log_likelihood(
  par = x_star,
  data = torch_tensor(data = model.matrix(~trt, data = dd)),
  status = torch_tensor(matrix(dd$status, ncol = 1)),
  time = torch_tensor(matrix(dd$eventtime, ncol = 1))
)
grad <- autograd_grad(ll, x_star, retain_graph = TRUE, create_graph = TRUE)[[1]]

# Using base R matrix here for simplicity
hess <- matrix(data = NA, nrow = length(x_star), ncol = length(x_star))
for (d in 1:length(grad)) {
  hess[d, ] <- as_array(autograd_grad(grad[d], x_star, retain_graph = TRUE)[[1]])
}
The variance-covariance matrix for the model coefficients will now be the inverse of the Hessian:
vcv <- solve(hess)To wrap up, the fitted model coefficients (with standard errors) will be:
results <- data.frame(beta = as_array(x_star), se = sqrt(diag(vcv)))
results
beta se
1 -1.6159527 0.005639768
2 -0.4950813 0.008709507Hopefully, the {torch} package in R will soon port the automatic Hessian calculation, which will simplify things further.
Finally, for comparison, we fit the same model using the equivalent R implementation from the (experimental) {streg} package:
library(streg)
expfit <- streg(
  formula = Surv(eventtime, status) ~ trt,
  data = dd,
  distribution = "exp"
)
summary(expfit)
Exponential regression -- log-relative hazard form
N. of subjects = 100000
N. of failures = 54174
Time at risk = 345727.5
Log likelihood = -131655.9
Estimate Std. Error z value Pr(>|z|)
(Intercept) -1.615311 0.005637 -286.54 <2e-16 ***
trt -0.495611 0.008707 -56.92 <2e-16 ***
---
Signif. codes: 0 '***' 0.001 '**' 0.01 '*' 0.05 '.' 0.1 ' ' 1This also uses automatic differentiation (via {TMB}), but nevertheless… pretty close, isn’t it?
That’s it for today, and as always, thank you for reading and feel free to get in touch if I got something terribly wrong or if you just want to have a chat about it. Cheers!